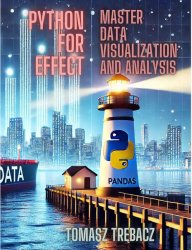
Python For Effect: Master Data Visualization and Analysis
- Добавил: literator
- Дата: 8-05-2025, 07:34
- Комментариев: 0
 Название: Python For Effect: Master Data Visualization and Analysis: Learn Data Pipelines, Machine Learning, Advanced Statistical Analysis and Visualization with Jupyter Notebook
Автор: Tomasz Trebacz
Издательство: Independently published
Год: October 23, 2024
Страниц: 222
Язык: английский
Формат: pdf, epub, mobi
Размер: 10.1 MB
Transform your career in just a few months with Python data science mastery—even if you've never written a line of code before!
Have you ever felt overwhelmed at the thought of learning data analysis in Python? Do you worry that without a computer science degree, you'll never be able to visualize and analyze data effectively? Are you eager to bring data-driven insights into your career but don’t know where to start? If you answered "yes" to these questions, you’re in good company. Countless students, professionals, and researchers face the same challenges, but those challenges are not insurmountable. You can grasp the power of Python for data science through the easy-to-follow methods you'll find in this book. Welcome to a structured roadmap towards mastering data analysis and visualization—your essential guide to developing effective Python skills in a clear, step-by-step manner. Discover the power of Python with this guide full of practical exercises, real-world examples, and up-to-date tools to support your learning journey.
You’ll begin by setting up your Python environment with tools like Anaconda and Jupyter Notebooks and then progress to more advanced subjects such as machine learning and statistical analysis. In parallel, we’ll explore foundational software engineering practices—like version control and environment management—to ensure a solid, sustainable framework for your data endeavors. The journey continues through core Python programming skills, data cleaning, and data preparation, culminating in the integration of machine learning algorithms for deeper analytical insights.
One of the book’s defining features is its practical, hands-on approach. Through illustrative examples and exercises, you’ll do more than learn theoretical concepts—you’ll apply them to real scenarios. This method is especially evident in the comprehensive case studies, which provide opportunities for you to tackle complex problems with the techniques you’ve acquired.
Visualization is at the heart of effective data analysis. Leveraging libraries like Matplotlib and Seaborn, you’ll learn to convert raw numbers into striking visual representations that shed light on hidden trends. By combining these visualization techniques with machine learning, you’ll gain a holistic view of how different data science tools converge to address sophisticated challenges.
In the vast ocean of Python's capabilities, where each library is a compass guiding us through the intricate waters of data analysis, Pandas stands as a lighthouse. It illuminates the path for anyone navigating the tumultuous seas of data manipulation and transformation. For the uninitiated, Pandas offers a powerful open-source data analysis and manipulation library, often heralded as the backbone of data science tasks in Python. Its prowess lies in its ability to take raw data and transform it into a structured form that is not only comprehensible but also primed for analysis. Whether you are a student embarking on a new project, an educator curating course materials, a researcher deciphering complex datasets, a business professional seeking insights, or a scientist unraveling empirical data, Pandas equips you with the tools to convert unstructured data into a cogent narrative.
Here’s a sneak peek at what’s inside:
100+ practical exercises and examples to solidify your Python skills.
14 essential tools every data analyst should master, including Pandas and NumPy.
Step-by-step guidance on data cleaning and preprocessing techniques.
5 real-world case studies to connect theory with practical business application.
Introduction to machine learning: Simplified and beginner-friendly.
5 proven strategies for effective data visualization using libraries like Matplotlib.
A detailed guide to setting up Jupyter Notebooks for interactive work.
Complete setup instructions for IDEs that support Python development.
Elevation of your data pipeline knowledge to industry standards.
Simple approaches to missing data, using imputation and transformation techniques.
7 software engineering best practices tailored for data projects.
Comprehensive explanations on regression analysis for analytic insight.
How to stay current with Python advancements without being overwhelmed.
Proven frameworks for data wrangling to simplify complex datasets.
Checklists for error-free coding and version control in your projects.
...and so much more unique content tailored to your learning needs!
You might think you've tried it all before, but you'll find this book different. It’s specifically designed to provide clarity and build confidence in your Python skills.
Whether you’re a student, researcher, or business professional, this guide will help demystify data analysis and adapt Python tools to your unique circumstances.
Ready to unlock effective data analysis skills? Scroll up and click "Download” now to begin mastering Python for your data visualization and analysis journey!
Скачать Python For Effect: Master Data Visualization and Analysis
[related-news] [/related-news]
Внимание
Уважаемый посетитель, Вы зашли на сайт как незарегистрированный пользователь.
Мы рекомендуем Вам зарегистрироваться либо войти на сайт под своим именем.
Уважаемый посетитель, Вы зашли на сайт как незарегистрированный пользователь.
Мы рекомендуем Вам зарегистрироваться либо войти на сайт под своим именем.
