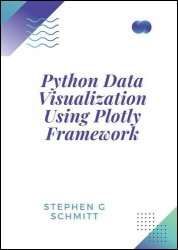
Python Data Visualization Using Plotly Framework
- Добавил: literator
- Дата: 3-02-2025, 18:21
- Комментариев: 0
 Название: Python Data Visualization Using Plotly Framework: Explore Plotly To Create Stunning Visualizations And Uncover Insights From Your Data
Автор: Stephen G Schmitt
Издательство: Independently published
Год: October 6, 2024
Страниц: 204
Язык: английский
Формат: epub
Размер: 10.1 MB
Python is of the most popular and versatile programming languages in the tech industry. However, despite their popularity and versatility, mastering them can be challenging, especially for beginners. Technical challenges such as debugging and tight deadlines can cause stress and anxiety, and career advancement and staying up to date with the latest developments in the field can be daunting.
The Plotly Python library is an interactive open-source library. This can be a very helpful tool for data visualization and understanding the data simply and easily. plotly graph objects are a high-level interface to plotly which are easy to use. It can plot various types of graphs and charts like scatter plots, line charts, bar charts, box plots, histograms, pie charts, etc.
So you all must be wondering why plotly over other visualization tools or libraries? Here’s the answer:
• Plotly has hover tool capabilities that allow us to detect any outliers or anomalies in a large number of data points.
• It is visually attractive that can be accepted by a wide range of audiences.
• It allows us for the endless customization of our graphs that makes our plot more meaningful and understandable for others.
Here what you'll learn after downloading this book:
- Introduction Plotly
- Different Types of Charts
- Histograms
- Box Plot
- 3D Plots
- Interacting with the Plots
And more…
This Book Is Perfect For:
- Total beginners with zero programming experience
- Returning professionals who haven’t written code in years
- Seasoned professionals looking for a fast, simple, crash course in Python
Скачать Python Data Visualization Using Plotly Framework
[related-news] [/related-news]
Внимание
Уважаемый посетитель, Вы зашли на сайт как незарегистрированный пользователь.
Мы рекомендуем Вам зарегистрироваться либо войти на сайт под своим именем.
Уважаемый посетитель, Вы зашли на сайт как незарегистрированный пользователь.
Мы рекомендуем Вам зарегистрироваться либо войти на сайт под своим именем.
