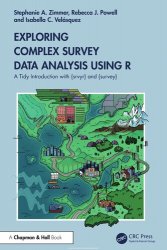
Exploring Complex Survey Data Analysis Using R
- Добавил: literator
- Дата: 9-11-2024, 06:12
- Комментариев: 0
 Название: Exploring Complex Survey Data Analysis Using R: A Tidy Introduction with {srvyr} and {survey}
Автор: Stephanie Zimmer, Rebecca Powell, Isabella Velásquez
Издательство: CRC Press
Год: 2025
Страниц: 361
Язык: английский
Формат: pdf (true)
Размер: 63.8 MB
Surveys are powerful tools for gathering information, uncovering insights, and facilitating decision-making. However, to ensure the accurate interpretation of results, they require specific analysis methods. In this book, readers embark on an in-depth journey into conducting complex survey analysis with the {srvyr} package and Tidyverse family of functions from the R programming language. Intended for intermediate R users familiar with the basics of the Tidyverse, this book gives readers a deeper understanding of applying appropriate survey analysis techniques using {srvyr}, {survey}, and other related packages. With practical walkthroughs featuring real-world datasets, such as the American National Election Studies and Residential Energy Consumption Survey, readers will develop the skills necessary to perform impactful survey analysis on survey data collected through a randomized sample design. Additionally, this book teaches readers how to interpret and communicate results of survey data effectively.
In this book, we focus on R to introduce survey analysis. Our goal is to provide a comprehensive guide for individuals new to survey analysis but with some familiarity with statistics and R programming. We use a combination of the {survey} and {srvyr} packages and present the code following best practices from the Tidyverse. The {survey} package was released on the Comprehensive R Archive Network (CRAN) in 2003 and has been continuously developed over time. This package, primarily authored by Thomas Lumley, offers an extensive array of features, including:
• Calculation of point estimates and estimates of their uncertainty, including means, totals, ratios, quantiles, and proportions
• Estimation of regression models, including generalized linear models, log-linear models, and survival curves
• Variances by Taylor linearization or by replicate weights, including balance repeated replication, jackknife, bootstrap, multistage bootstrap, or user-supplied methods
• Hypothesis testing for means, proportions, and other parameters
The {srvyr} package builds on the {survey} package by providing wrappers for functions that align with the tidyverse philosophy. This is our motivation for using and recommending the {srvyr} package. We find that it is user-friendly for those familiar with the tidyverse packages in R. For example, while many functions in the {survey} package access variables through formulas, the {srvyr} package uses tidy selection to pass variable names, a common feature in the Tidyverse.
Often, a survey analysis project produces a lot of code. Keeping track of the latest version can become challenging, as files evolve throughout a project. If a team of analysts is working on the same script, someone may use an outdated version, resulting in incorrect results or redundant work. Version control systems like Git can help alleviate these pains. Git is a system that tracks changes in files. We can use Git to follow code evaluation and manage asynchronous work. With Git, it is easy to see any changes made in a script, revert changes, and resolve differences between code versions (called conflicts).
R environments with Docker: Just as different versions of packages can introduce discrepancies or compatibility issues, the version of R can also prevent reproducibility. Tools such as Docker can help with this potential issue by creating isolated environments that define the version of R being used, along with other dependencies and configurations. The entire environment is bundled in a container. The container, defined by a Dockerfile, can be shared so that anybody, regardless of their local setup, can run the R code in the same environment.
Key Features:
Uses the {srvyr} package and Tidyverse family of packages.
Grants a conceptual understanding of the statistical methods that the functions apply to.
Includes practical walkthroughs using publicly available survey data.
Provides the reader with the tools for interpreting, visualizing, and presenting results.
Prerequisites:
To get the most out of this book, we assume a survey has already been conducted and readers have obtained a microdata file. Microdata, also known as respondent-level or row-level data, differ from summarized data typically found in tables. Microdata contain individual survey responses, along with analysis weights and design variables such as strata or clusters.
Additionally, the survey data should already include weights and design variables. These are required to accurately calculate unbiased estimates. The concepts and techniques discussed in this book help readers to extract meaningful insights from survey data, but this book does not cover how to create weights, as this is a separate complex topic.
This book is tailored for analysts already familiar with R and the Tidyverse, but who may be new to complex survey analysis in R.
Скачать Exploring Complex Survey Data Analysis Using R
[related-news] [/related-news]
Внимание
Уважаемый посетитель, Вы зашли на сайт как незарегистрированный пользователь.
Мы рекомендуем Вам зарегистрироваться либо войти на сайт под своим именем.
Уважаемый посетитель, Вы зашли на сайт как незарегистрированный пользователь.
Мы рекомендуем Вам зарегистрироваться либо войти на сайт под своим именем.
