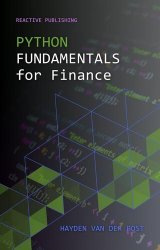
Python Fundamentals for Finance: A survey of Algorithmic Options trading with Python
- Добавил: literator
- Дата: 28-02-2024, 05:34
- Комментариев: 0
 Название: Python Fundamentals for Finance: A survey of Algorithmic Options trading with Python
Автор: Hayden Van Der Post
Издательство: Reactive Publishing
Год: 2024
Страниц: 287
Язык: английский
Формат: pdf, epub
Размер: 10.1 MB
In the extensive array of financial markets, options trading is an art form that offers a wide range of opportunities for both experienced traders and beginners. At its essence, options trading involves buying or selling the right to purchase or sell an asset at a predetermined price within a specific timeframe. This intricate financial instrument comes in two main forms: call options and put options.
A well-configured Python environment is fundamental for efficient financial analysis using Python. Setting up this foundation ensures that the necessary tools and libraries for options trading are readily available.
Within the realm of software development, object-oriented programming (OOP) emerges as a foundational paradigm that not only structures code but also conceptualizes it in terms of tangible objects found in the real world. Python, with its adaptable nature, wholeheartedly embraces OOP, bestowing developers with the ability to forge modular and scalable financial applications.
Another crucial aspect of Python's data types and structures is their ability to handle data manipulation and analysis. Python provides a rich ecosystem of libraries and packages that specialize in data science and financial analysis. For instance, the Pandas library excels at manipulating and analyzing structured data, making it an essential tool for financial analysis tasks such as data cleaning, transformation, and aggregation. When combined with libraries like NumPy and Matplotlib, which provide powerful numerical computing and visualization capabilities, Python becomes an invaluable tool for financial analysts.
In Python data analysis, the Pandas library stands as a giant, offering sturdy, adaptable, and efficient tools for managing and analyzing financial datasets. Its DataFrame object is a powerhouse, capable of effortlessly holding and manipulating diverse data – a common scenario in finance. Financial data can vary and be challenging to handle, with different frequencies, missing values, and a mixture of data types. Pandas is purposefully crafted to gracefully handle these challenges. It enables the management of time series data, which is vital for financial analysis, with features to resample, interpolate, and shift data sets temporally. Pandas simplifies the process of reading data from diverse sources, whether they are CSV files, SQL databases, or even online sources. With a single line of code, one can import a CSV file containing historical stock prices into a DataFrame and commence analysis.
The saying "a picture is worth a thousand words" holds particularly true in financial analysis. Visual representations of data are not just convenient but potent tools for uncovering insights that may remain elusive within rows of numbers. Matplotlib and Seaborn, two prominent Python libraries for data visualization, empower analysts to create a wide range of static, interactive, and animated visualizations with ease.
Contents:
Скачать Python Fundamentals for Finance: A survey of Algorithmic Options trading with Python
[related-news] [/related-news]
Внимание
Уважаемый посетитель, Вы зашли на сайт как незарегистрированный пользователь.
Мы рекомендуем Вам зарегистрироваться либо войти на сайт под своим именем.
Уважаемый посетитель, Вы зашли на сайт как незарегистрированный пользователь.
Мы рекомендуем Вам зарегистрироваться либо войти на сайт под своим именем.

