- Добавил: literator
- Дата: 24-03-2023, 21:13
- Комментариев: 0
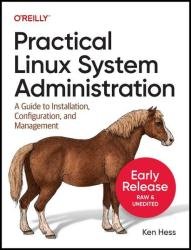 Название: Practical Linux System Administration: A Guide to Installation, Configuration, and Management (Fourteenth Early Release)
Автор: Ken Hess
Издательство: O’Reilly Media, Inc.
Год: 2023-03-23
Страниц: 274
Язык: английский
Формат: epub (true), mobi
Размер: 10.2 MB
This essential guide covers all aspects of Linux system administration, from user maintenance, backups, filesystem housekeeping, storage management, and network setup to hardware and software troubleshooting and some application management. It's both a practical daily reference manual for sysadmins and IT pros and a handy study guide for those taking Linux certification exams. Linux system administration means different things to different people. Administration, for this book, means the daily actions that a Linux system administrator must take to manage and support users, maintain system health, implement best practices for security, install software, and perform housekeeping tasks. You’ll spend a significant portion of your time at the command line, also known as the command line interface (CLI).

 Название: The Complete Linux Coding Manual - 17th Edition, 2023
 Название: Essential Statistics for Data Science: A Concise Crash Course
 Название: Designing Data Governance from the Ground Up: Six Steps to Build a Data-Driven Culture
 Название: Data Mining: Concepts and Techniques, 4th Edition
 Название: Exam Ref PL-900 Microsoft Power Platform Fundamentals, 2nd Edition
 Название: Azure SQL Hyperscale Revealed: High-performance Scalable Solutions for Critical Data Workloads
 Название: Windows Everywhere : The rise and fall of the most important software platform of all time
 Название: Guide to Teaching Data Science: An Interdisciplinary Approach
 Название: Chromebook For Dummies, 3rd Edition