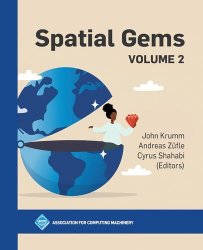
Spatial Gems: Volume 2
- Добавил: literator
- Дата: 7-02-2024, 19:27
- Комментариев: 0
 Название: Spatial Gems: Volume 2
Автор: John Krumm, Andreas Züfle, Cyrus Shahabi
Издательство: ACM Books
Год: 2024
Страниц: 158
Язык: английский
Формат: pdf (true), epub
Размер: 34.2 MB
Spatial gems are computational techniques for processing spatial data. This book, a follow-up to the first Spatial Gems volume, is a further collection of techniques contributed by leading research experts. Although these approaches were developed by their authors as part of larger research projects, the gems represent fundamental solutions that are generically applicable to many different problems. Our goal is to expose these useful techniques that are not yet in textbooks and often buried inside technical research papers to share them with software developers, graduate students, professors, and professional researchers.
Here are short summaries of each spatial gem:
1) Graph Sampling for Map Comparison—Comparing two road maps is a basic operation that arises in a variety of situations. A map comparison method that is commonly used, mainly in the context of comparing reconstructed maps to ground truth maps, is based on graph sampling. The essential idea is to first compute a set of point samples on each map, and then to match pairs of samples—one from each map—in a one-to-one fashion. For deciding whether two samples can be matched, different criteria can be used. The total number of matched pairs gives a measure of how similar the maps are.
2) Fast 3D Euclidean Connected Components—We present an efficient algorithm and implementation for computing the connected components within a 3D cube of voxels, also known as the Euclidean union–find problem.
3) Multi scale Aggregation Over Sliding Windows—Aggregates over sliding windows are an important part of many analyses over raster images, including computation of basic statistic quantities, regression analysis, fractal dimensions, and topographic analysis. For those analyses, the most appropriate window size is not always obvious a priori, and the window sizes may be very large. An algorithm is presented for aggregating windows iteratively with a
performance that is logarithmic in the window size.
4) Gaussian Process for Trajectories—The Gaussian process is a powerful and flexible technique for interpolating spatiotemporal data, especially with its ability to capture complex trends and uncertainty from the input signal. This chapter describes Gaussian processes as an interpolation technique for
geospatial trajectories.
5) Mean Chord Length of a Square—This chapter derives the mean chord length of a square. For a circle, a chord is a straight-line segment connecting any two points on the perimeter. The same is true for a square.
6) Object Delineation in Satellite Images—Machine Learning is being widely applied to analyze satellite data with problems such as classification and feature detection. Unlike traditional image processing algorithms, geospatial applications need to convert the detected objects from a raster form to a geospatial vector form to further analyze it.
7) Implementing Simulation of Simplicity for Geometric Degeneracies—We describe how to implement Simulation of Simplicity (SoS). SoS removes geometric degeneracies in point-in-polygon queries, polyhedron intersection, map overlay, and other 2D and 3D geometric and spatial algorithms by determining the effect of adding non-Archimedean infinitesimals of different orders to the coordinates. It then modifies the geometric predicates to emulate that, and evaluates them in the usual arithmetic.
8) Probabilistic Counting in Uncertain Spatial Databases Using Generating Functions—Many applications using spatial data require counting the number of spatial objects within a region. In cases where the locations of objects are uncertain, this count becomes a random variable.
9) Statistics for All Walks on a Lattice Graph—Trajectory data from a moving entity may be handicapped by the temporal gaps between location measurements. We can make inferences about the locations visited during the gaps by postulating all possible paths between pairs of temporally adjacent measurements. These paths are modeled as walks on a spatially discrete grid, represented as a lattice graph.
10) Online Heatmap Generation with Both High and Low Weights—Heatmap is a common geovisualization method that interpolates and visualizes a set of point observations on a map surface. Most online web mapping libraries implement a one-pass heatmap algorithm using HTML5 canvas or WebGL for efficient heatmap generation. We introduce Hilomap, an online heatmap algorithm that highlights surface areas where points with both low and high trends are located. An HTML5 canvas-based reference implementation on OpenLayers is presented and evaluated. Hilomap has as an open source jаvascript implementation and can be downloaded at GitHub.
When using Python with NumPy, it is moreover advantageous to use an array-based implementation in which four one-dimensional arrays are aggregated in a single step rather than iterating over array elements one at a time and aggregating four individual raster points. Algorithm shows the pseudocode.
Скачать Spatial Gems: Volume 2
[related-news] [/related-news]
Внимание
Уважаемый посетитель, Вы зашли на сайт как незарегистрированный пользователь.
Мы рекомендуем Вам зарегистрироваться либо войти на сайт под своим именем.
Уважаемый посетитель, Вы зашли на сайт как незарегистрированный пользователь.
Мы рекомендуем Вам зарегистрироваться либо войти на сайт под своим именем.
