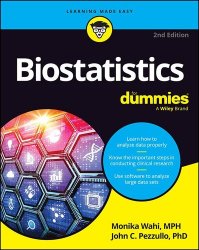
Biostatistics For Dummies, 2nd Edition
- Добавил: literator
- Дата: 17-06-2024, 03:54
- Комментариев: 0
 Название: Biostatistics For Dummies, 2nd Edition
Автор: Monika M. Wahi, John C. Pezzullo
Издательство: For Dummies
Год: 2024
Страниц: 432
Язык: английский
Формат: epub (true)
Размер: 10.1 MB
Break down biostatistics, make sense of complex concepts, and pass your class.
If you're taking biostatistics, you may need or want a little extra assistance as you make your way through. Biostatistics For Dummies follows a typical biostatistics course at the college level, helping you understand even the most difficult concepts, so you can get the grade you need. Start at the beginning by learning how to read and understand mathematical equations and conduct clinical research. Then, use your knowledge to analyze and graph your data. This new edition includes more example problems with step-by-step walkthroughs on how to use statistical software to analyze large datasets. Biostatistics For Dummies is your go-to guide for making sense of it all.
Biostatistics is the practical application of statistical concepts and techniques to topics in the biology and life sciences fields. Because these are broad fields, biostatistics covers a very wide area. It is used when studying many types of experimental units, from viruses to trees to fleas to mice to people. Biostatistics involves designing research studies, safely conducting human research, collecting and verifying research data, summarizing and displaying the data, and analyzing the data to answer research hypotheses and draw meaningful conclusions.
It is not possible to cover all the subspecialties of biostatistics in one book, because such a book would have to include chapters on molecular biology, genetics, agricultural studies, animal research (both inside and outside the lab), clinical trials, and epidemiological research. So instead, we focus on the most widely applicable topics of biostatistics and on the topics that are most relevant to human research based on a survey of graduate-level biostatistics curricula from major universities.
The purpose of this chapter is to help you make informed choices about statistical software. We describe and provide guidance regarding the practical choices you have today among the statistical software available. We discuss choosing between:
• Commercial software, such as SAS and SPSS
• Open-source software, such as R and Python
• Free software applications, such as G*Power and PS (Power and Sample Size Calculation)
We also provide guidance on how to choose between code-based and non–code-based software, and end by providing advice on cloud data storage.
The two most popular and extensive open-source statistical programs are R and Python:
• R: R is statistical software that has been developed and is maintained by the R user community. It has two interfaces: R GUI, which looks similar to PC SAS and SPSS, and RStudio, which is an integrated development environment (IDE). Analysts prefer to use RStudio when developing graphical displays for the web, while R GUI is fine for most statistical work. To run R, you download and install the base application. Then, for specified functions not included in the base application, you install additional R packages. Like with PC SAS, in R, you import or connect to datasets, develop and save code files to run on those datasets, and produce output you can save. Base R, R packages, and documentation are available on the Comprehensive R Archive Network (CRAN) server.
• Python: Python is an open-source programming language that is often used to analyze data. As with R, Python is developed and maintained by its own user community and runs in a similar way. Although you still develop code that runs against datasets in the Python environment, the Python and R code are different. Instead of packages as in R, Python has libraries.
• Review basic statistics and decode mathematical equations
• Learn how to analyze and graph data from clinical research studies
• Look for relationships with correlation and regression
• Use software to properly analyze large datasets
Anyone studying in clinical science, public health, pharmaceutical sciences, chemistry, and epidemiology-related fields will want this book to get through that biostatistics course.
Contents:
Скачать Biostatistics For Dummies, 2nd Edition
[related-news] [/related-news]
Внимание
Уважаемый посетитель, Вы зашли на сайт как незарегистрированный пользователь.
Мы рекомендуем Вам зарегистрироваться либо войти на сайт под своим именем.
Уважаемый посетитель, Вы зашли на сайт как незарегистрированный пользователь.
Мы рекомендуем Вам зарегистрироваться либо войти на сайт под своим именем.

